The Partners KPIs tab shows the revenue, cost, and profit generated with subcontracted partners. It mirrors the Fleet KPIs view, but for outsourced transports rather than your own trucks.
Table of Content
IMPARGO Knowledge Center
Unleash the full potential of our software with our comprehensive Knowledge Center, offering detailed information on its functionality and features.
The Partners KPIs tab shows the revenue, cost, and profit generated with subcontracted partners. It mirrors the Fleet KPIs view, but for outsourced transports rather than your own trucks.
Open Partners KPIs from the tabs at the top of the Report view. It mirrors Fleet KPIs, with headline cards, a monthly chart, and a per-partner ranking.
The card row sums up your subcontractor activity for the selected period:

In the example above, 7 active partners generated 67,551 EUR revenue at 53,348 EUR cost, for 14,203 EUR profit.
Monthly revenue, cost, and profit trend, filterable per partner.
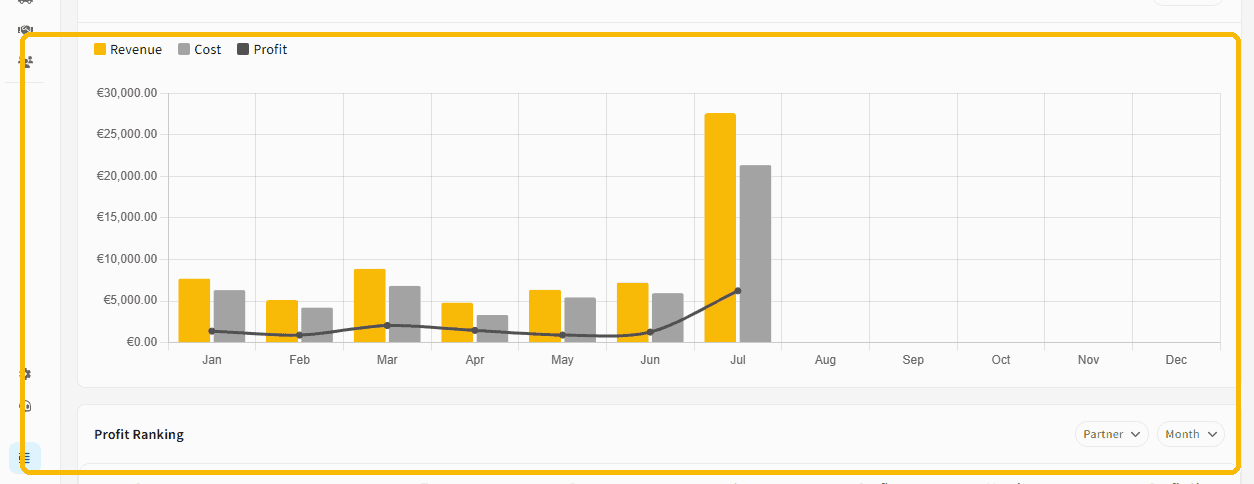
One row per partner: transports, revenue, cost, profit, margin, and profit share.
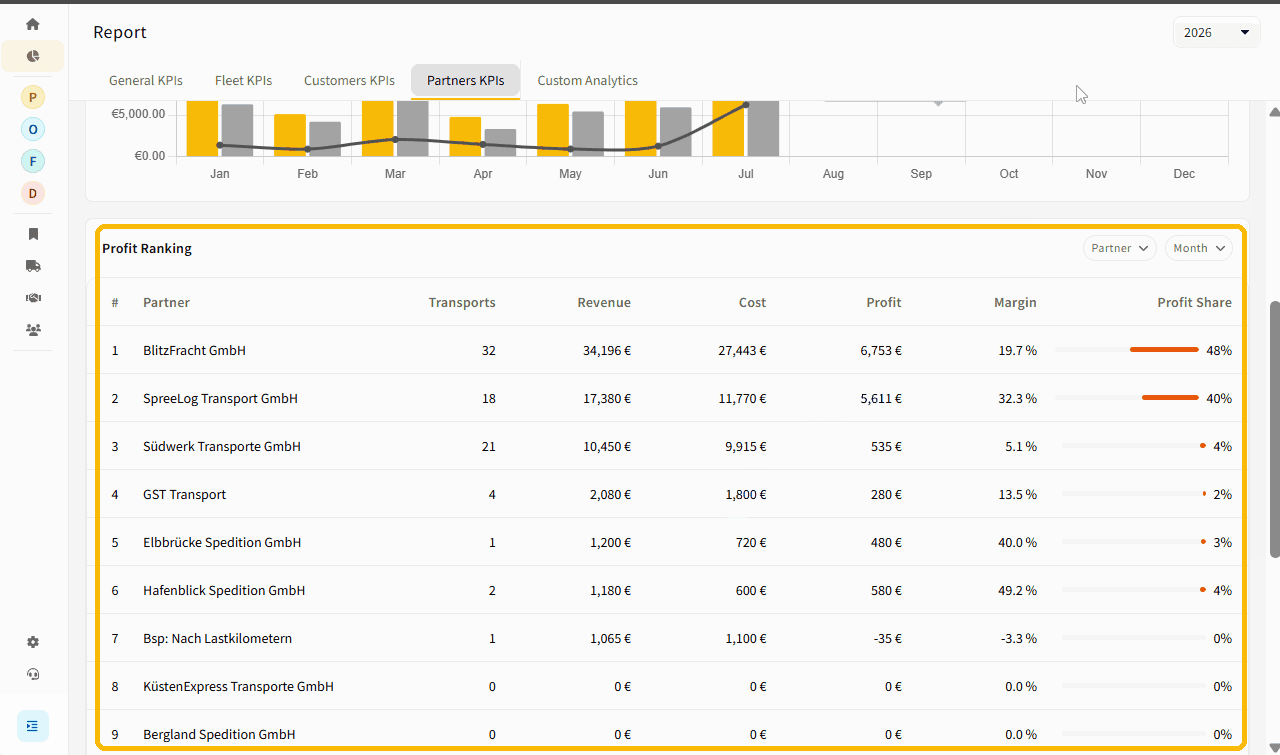
In the example above, the leading partner returns about 6,750 EUR profit at a 19.7% margin, while some partners sit at or below breakeven, which the ranking makes obvious.
For subcontracted transports, both revenue (the customer price) and cost (the subcontractor price) are known exactly at order level. Profit per partner is therefore directly accurate: there is no empty mileage or fixed-cost estimation involved, unlike own-fleet vehicles.
© IMPARGO 2026, All rights reserved.