The Customers KPIs tab shows how much revenue, and optionally cost and profit, each customer generates. It turns "our biggest customer" from a gut feeling into a ranked, per-account number.
Table of Content
IMPARGO Knowledge Center
Unleash the full potential of our software with our comprehensive Knowledge Center, offering detailed information on its functionality and features.
The Customers KPIs tab shows how much revenue, and optionally cost and profit, each customer generates. It turns "our biggest customer" from a gut feeling into a ranked, per-account number.
Open Customers KPIs from the tabs at the top of the Report view. The tab is organized into headline cards, a monthly chart, and a per-customer ranking.
The card row summarizes your customer base for the selected period:
The four cards sit in a row at the top of the tab:

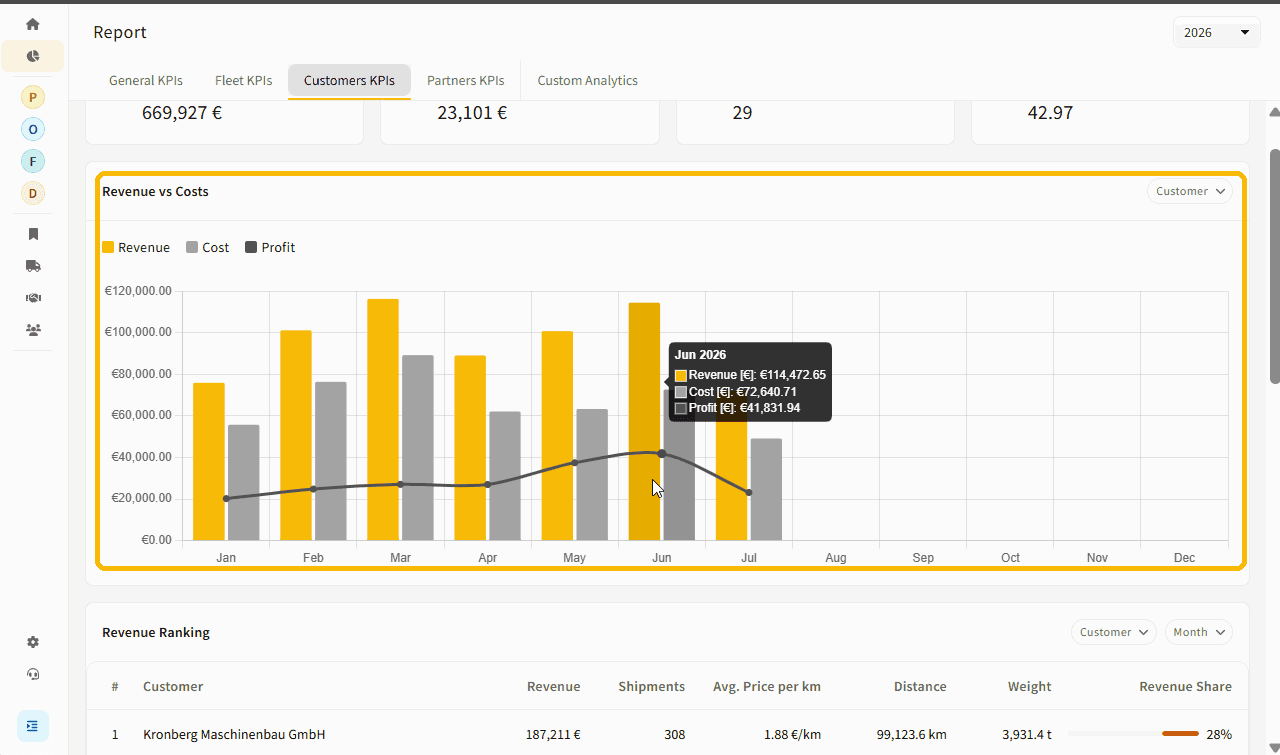
In the example above, 29 active customers generated 669,927 EUR in revenue, averaging 23,101 EUR and 42.97 shipments each.
The Revenue vs Costs chart plots monthly revenue, cost, and profit. Use the filter at the top right to focus on a single customer, and hover any month to read its exact figures.
One row per customer: revenue, shipments, average price per km, distance, weight, and revenue share. Rows are ranked by revenue share, so your largest accounts sit at the top. It mirrors the ranking in Partners KPIs on the subcontractor side.
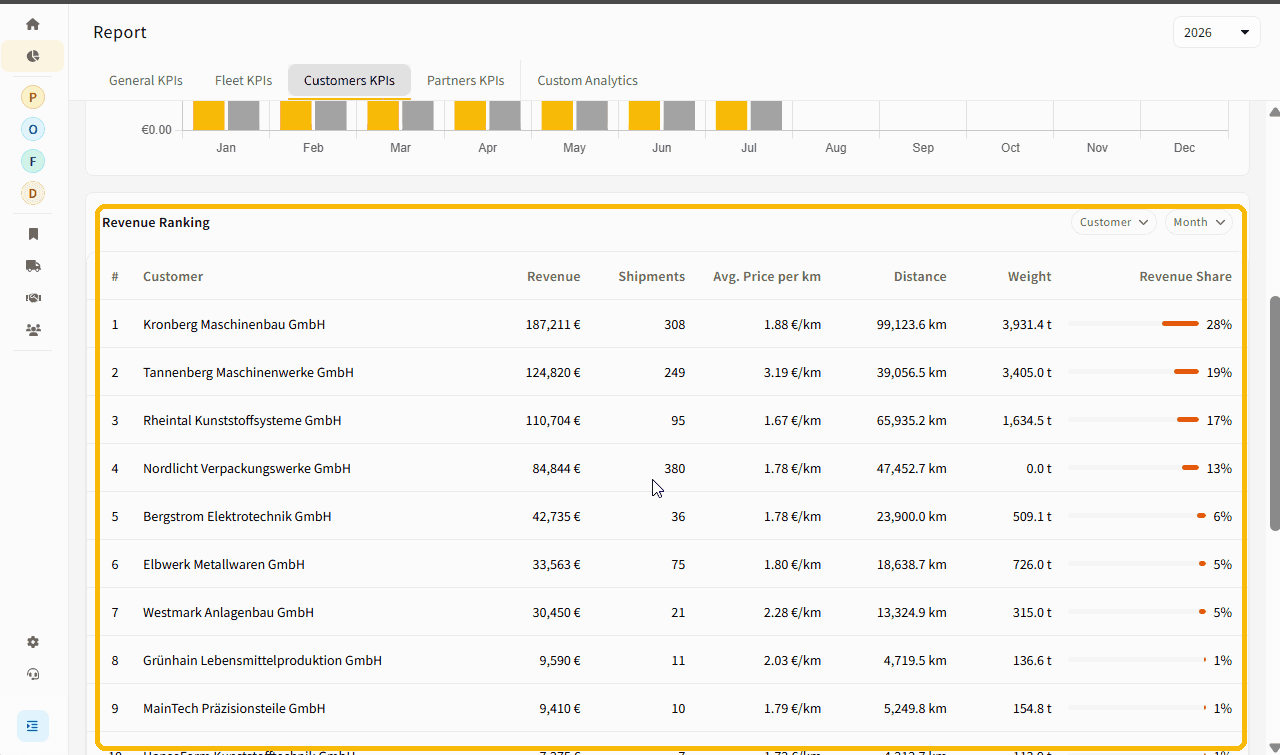
In the example above, the top account alone makes up 28% of revenue and the top four together most of it, exactly the concentration this ranking surfaces.
Customer KPIs are based on shipments, not transports. When several customers share one truck load (a fused tour), there is one transport but several shipments. This split is what lets revenue and cost be attributed to the correct customer.
Customer cost uses the cost value stored directly on the shipment. When shipments are fused into one tour, costs are not split automatically: they must be updated manually per shipment after fusing.
© IMPARGO 2026, All rights reserved.