Unleash the full potential of our software with our comprehensive Knowledge Center, offering detailed information on its functionality and features.
PLANNER: Truck, Toll & Tour Calculation
ORDERS: Order Management
ORDERS: Offer Management
FLEET: Execute With The DriverApp
DISPATCH: The Dispatch Board for Trucks
DRIVERAPP: Order Execution & Truck Navigation for Drivers
Managing Master Data
Analytics
Help Center
Integrations
Fleet KPIs: cost and profit per vehicle
The Fleet KPIs tab breaks profitability down to the vehicle level, so you can see which trucks are profitable and which are not. It is where a company-level number turns into an action: retire, reprice, or better utilize a specific vehicle.
Open Fleet KPIs from the tabs at the top of the Report view and read it top to bottom: headline KPI cards, two charts, and a per-vehicle ranking. The full month-by-month cost breakdown has its own section below.
Top KPI cards
The card row sums up the whole fleet for the selected period:
Fleet Revenue and Fleet Profit
Variable Costs and Fixed Costs
In the example above, the fleet earned 1,394,010 EUR revenue with 636,901 EUR variable and 159,984 EUR fixed cost, for 597,125 EUR fleet profit before company-level overhead.
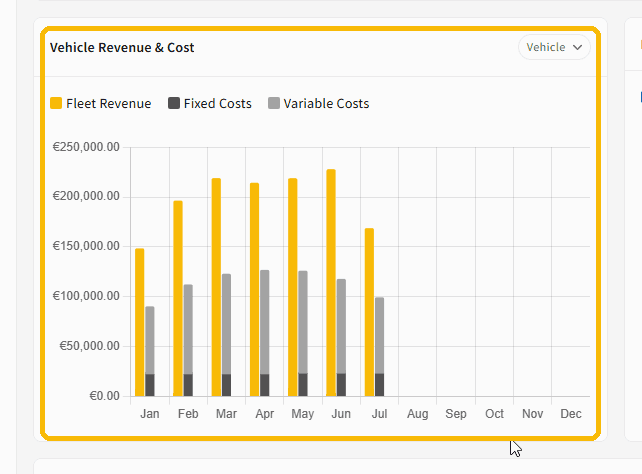
Vehicle Revenue & Cost chart
Monthly revenue against fixed and variable cost per vehicle, so seasonal dips and cost creep are easy to see.
In the example above, monthly vehicle revenue peaks near 230,000 EUR, with fixed and variable cost stacked in each bar.
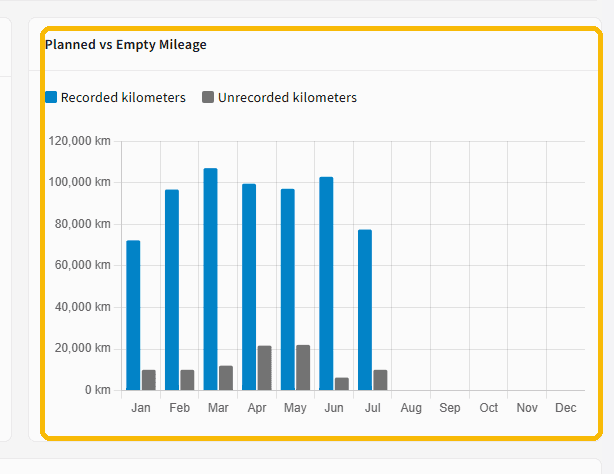
Planned vs Empty Mileage chart
Recorded (revenue-earning) kilometers against unrecorded, empty kilometers per month. A high empty share is the clearest signal of utilization you are paying for but not billing. This empty mileage is also what scales up the own-fleet variable costs in the General KPIs profitability table.
In the example above, recorded kilometers run around 70,000 to 105,000 per month, while unrecorded empty kilometers stay much smaller.
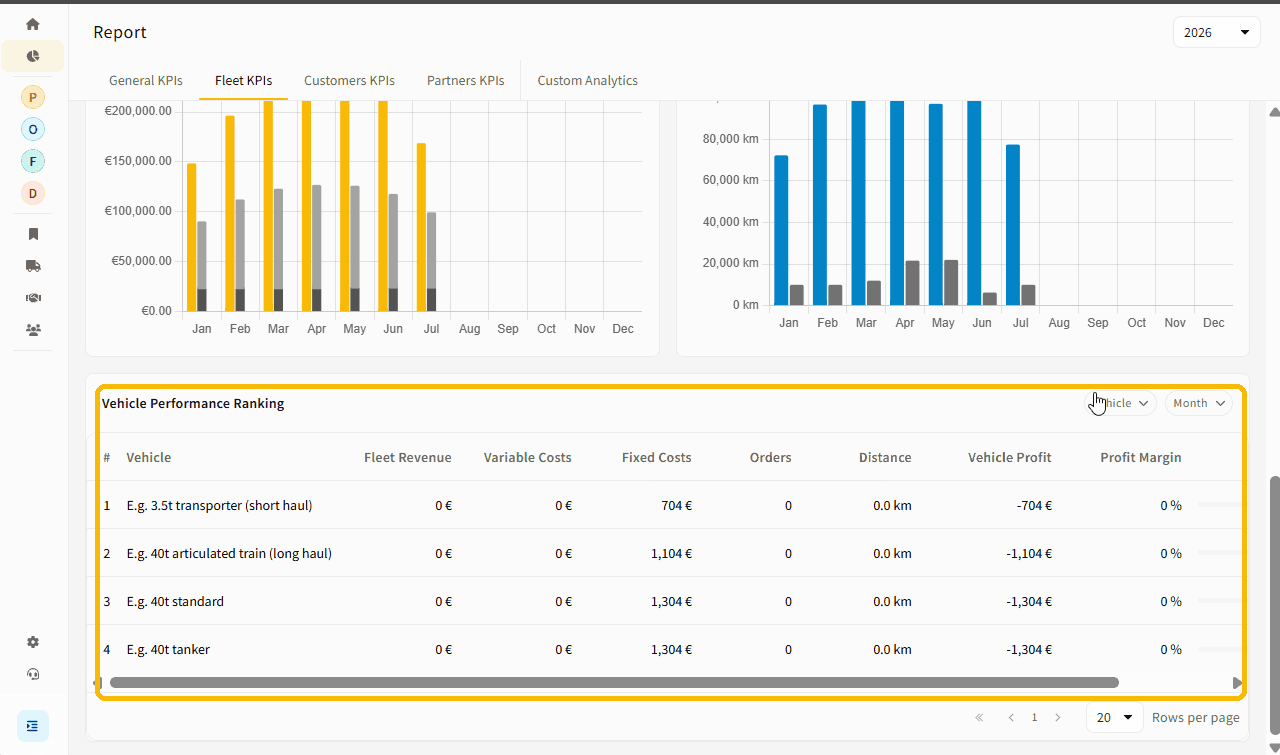
Vehicle Performance Ranking table
One row per vehicle, ranked so the strongest and weakest trucks are obvious. Columns: fleet revenue, variable costs, fixed costs, orders, distance, vehicle profit, profit margin, and profit share. It is the own-fleet counterpart to the rankings in Customers KPIs and Partners KPIs.
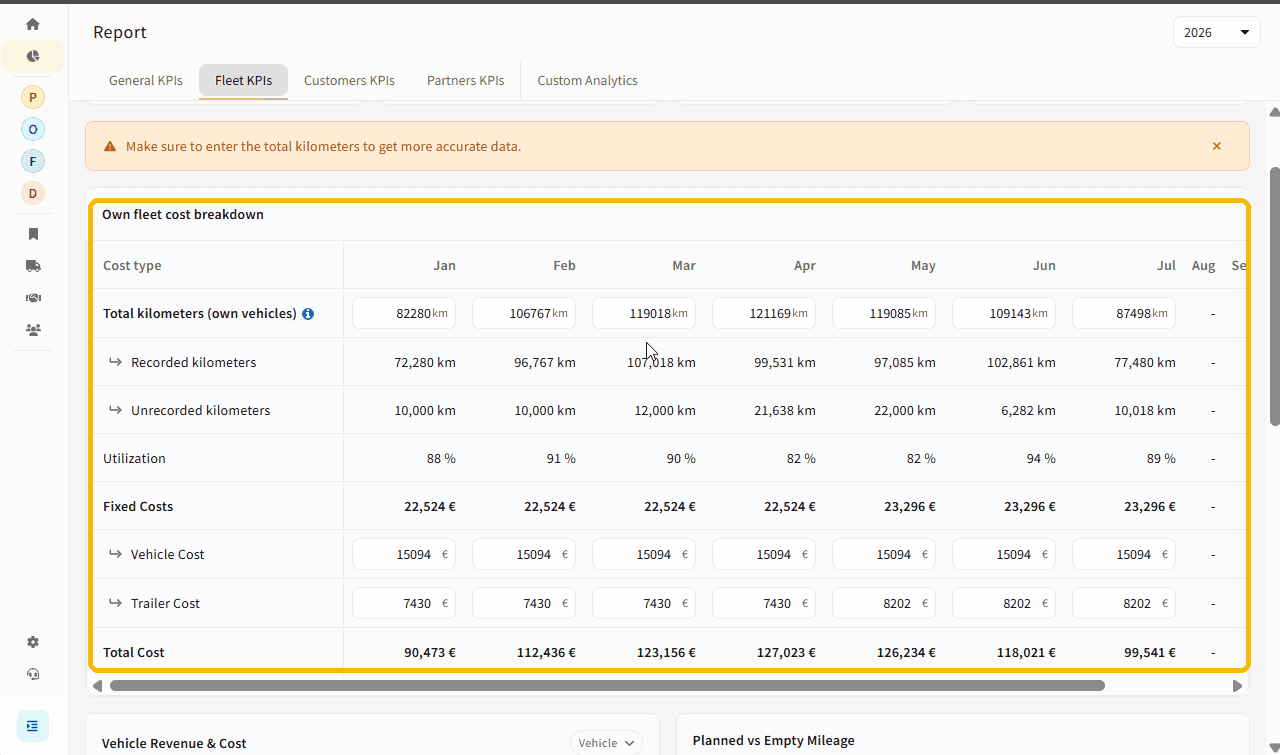
2. Own Fleet Cost Breakdown
The Own fleet cost breakdown table shows, per month, how each vehicle's cost is built up. Rows marked editable can be entered or overridden manually. Entering total kilometers is what unlocks accurate empty-mileage and utilization figures.
Row by row:
Row
What it is
How it is calculated
Total kilometers (own vehicles)
Real total distance driven, including empty mileage
Manual input, entered from your telematics system. Defaults to recorded kilometers if not entered.
↳ Recorded kilometers
Distance covered by active orders
Sum of planned or driven distance from orders assigned to the vehicle
↳ Unrecorded kilometers
Empty distance not tied to an order
Total kilometers minus recorded kilometers
Utilization
Share of driven distance that is order-based
Recorded kilometers / Total kilometers
Fixed Costs
Costs that occur regardless of distance driven
Sum of the vehicle and trailer fixed cost below, calculated from the vehicle profiles configured on your account
↳ Vehicle costs
Fixed vehicle cost
From the vehicle cost profile. Can be manually overridden.
↳ Trailer costs
Fixed trailer cost
From the trailer cost profile. Can be manually overridden.
Total Cost
Full cost for the vehicle that month
Fixed costs plus variable costs, where the variable costs (vehicle & trailer, toll, additional; see General KPIs for details) are scaled up by 1 / Utilization to account for empty mileage
3. Notes and Limitations
Without total fleet mileage entered, unrecorded kilometers default to 0, utilization shows as 100%, and vehicle profit is overstated.
Historical accuracy is affected by later changes to cost profiles (for example driver wage or fuel price), because each order keeps the cost settings that were valid at the time it was created.
⚠ Warning
If empty mileage is missing, every own-fleet profit figure on this tab reads too high. Enter total fleet mileage (from telematics) before you make retire-or-keep decisions on a vehicle.