Unleash the full potential of our software with our comprehensive Knowledge Center, offering detailed information on its functionality and features.
PLANNER: Truck, Toll & Tour Calculation
ORDERS: Order Management
ORDERS: Offer Management
FLEET: Execute With The DriverApp
DISPATCH: The Dispatch Board for Trucks
DRIVERAPP: Order Execution & Truck Navigation for Drivers
Managing Master Data
Analytics
Help Center
Integrations
General KPIs: track company profitability
The General KPIs tab gives you a company-level view of revenue, costs, and profitability per month and per year. It is the starting point in the Analytics module: see whether your transport business is profitable overall, before you drill into individual vehicles, customers, or partners.
Key Point
The Analytics module is available on every plan and reads the orders, cost profiles, and fleet data you already keep in the IMPARGO TMS, so there is nothing to set up. Non-Business plans limit how many orders you can add, which in turn limits how complete the analytics can be.

The Analytics module opens on the Report view. You reach it from the dashboard: click Go to Analytics on the Analytics card, or the Analytics icon in the left navigation.
Use the year selector at the top right to set the reporting year. Every card, chart, and table on the tab then updates to show that year.
Top KPI cards
The card row summarizes the selected period at a glance:
Total Revenue, Total Costs, and Profit
Avg Revenue/km and Avg. Cost per Ton
Total Orders and Total Distance (recorded)
Avg Stops/Transport
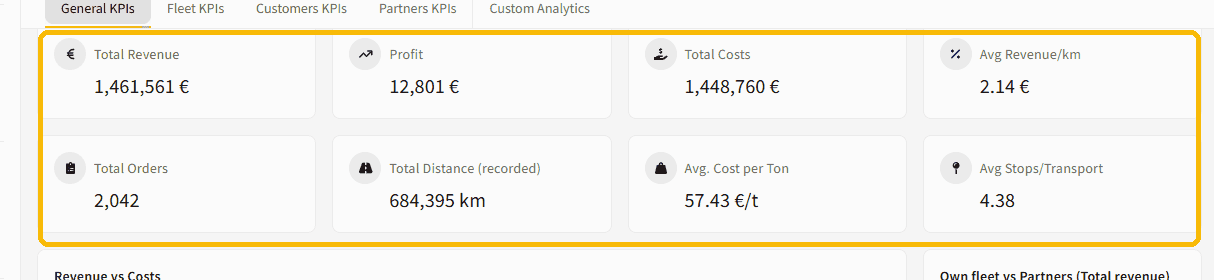
The eight cards sit in a row at the top of the tab:
In the example above, the company shows 1,461,561 EUR revenue against 1,448,760 EUR cost for 12,801 EUR profit, across 2,042 orders and 684,395 recorded kilometers.
Revenue vs Costs chart
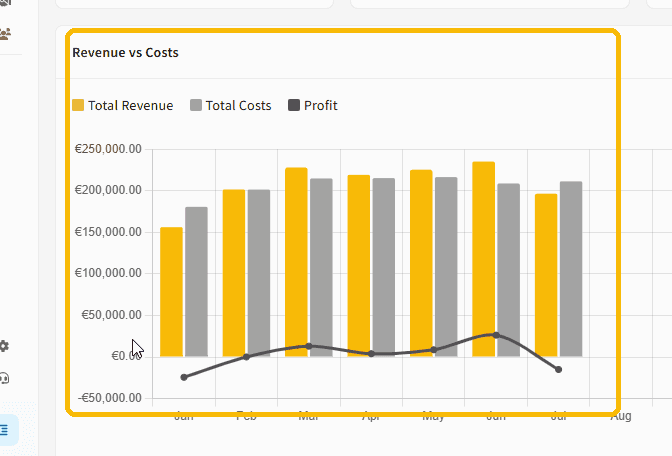
Monthly bars for revenue and cost, with a profit line overlaid on top, so you can see the trend across the year and spot the months where cost caught up with revenue.
In the example above, monthly revenue runs between roughly 150,000 EUR and 235,000 EUR, with the profit line sitting just above zero all year.
Own fleet vs Partners (Total revenue) donut
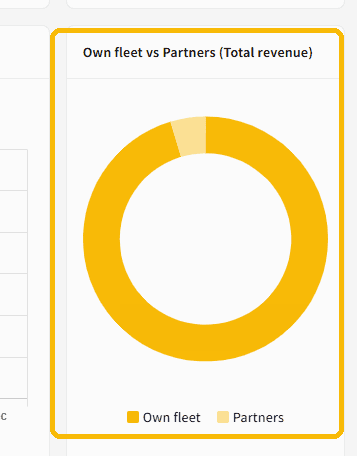
A donut chart showing the share of total revenue generated by your own fleet versus subcontracted partners. It answers a question most dispatchers cannot answer from memory: how much of the business actually runs on your own trucks.
In the example above, almost all revenue comes from the own fleet, with only a thin slice from subcontracted partners.
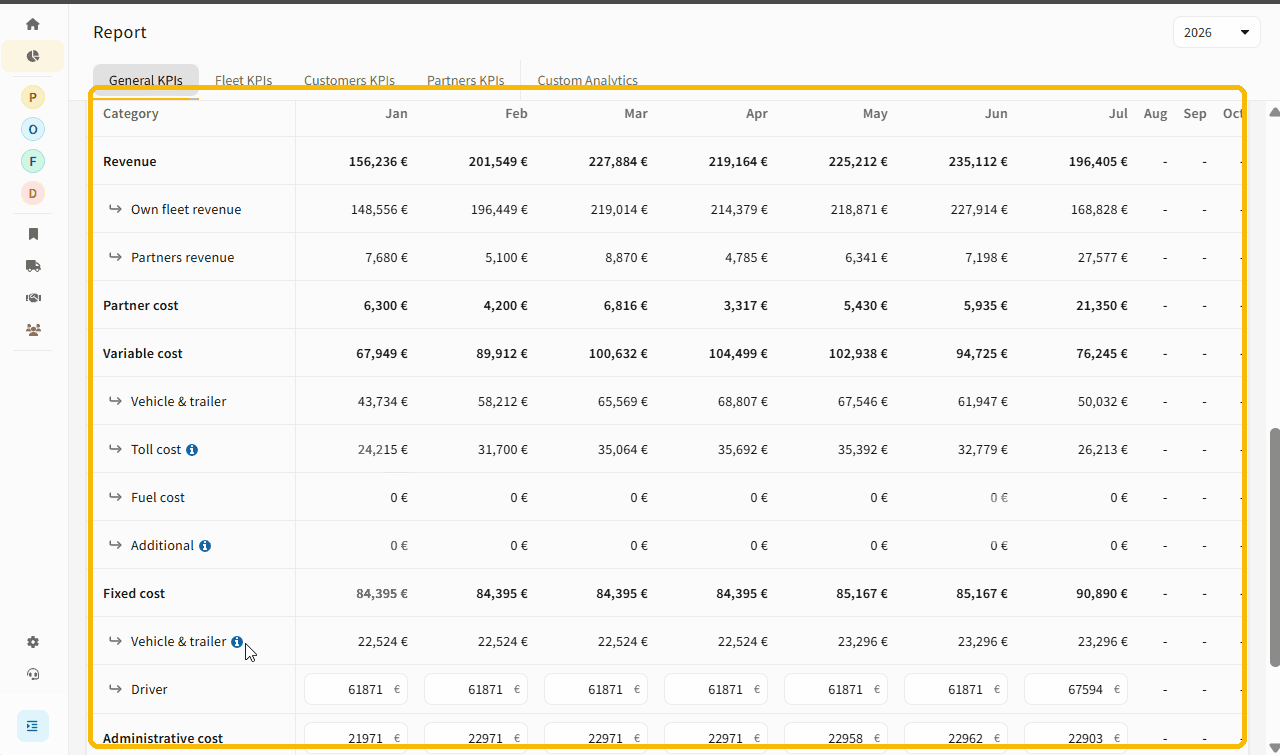
Full Profitability Overview table
A month-by-month breakdown (one column per month, plus a year total) of how revenue becomes profit. The rows are grouped into revenue, cost, and result. Rows marked as editable can be overridden manually per month.
Row by row:
Row
What it is
How it is calculated
Revenue
Total revenue for the month
Sum of order prices
↳ Own fleet revenue
Revenue from orders run with your own vehicles
Sum of order prices where no partner is assigned. Orders with no assigned asset also count here.
↳ Partners revenue
Revenue from orders run by subcontractors
Sum of order prices where a partner is assigned
Partner cost
Cost of subcontracted transports
Sum of partner cost for orders assigned to a partner, including toll costs and additional charges where added
Variable cost
Variable costs of your own fleet
Sum of the vehicle & trailer, toll, fuel, and additional costs below. All except additional costs are scaled up to account for unrecorded empty mileage (see the Fleet KPIs article).
↳ Vehicle & trailer
Distance-based vehicle and trailer cost
From the order cost calculation, scaled for empty mileage
↳ Toll cost
Toll cost for own-fleet orders only
From the order cost calculation, scaled for empty mileage
↳ Fuel cost
Fuel cost
From the order cost calculation, scaled for empty mileage
↳ Additional
Additional charges and bulk product costs
Sum of additional charges plus bulk product costs on own-fleet orders. Partner orders are excluded (counted under Partner cost instead). Not scaled for empty mileage.
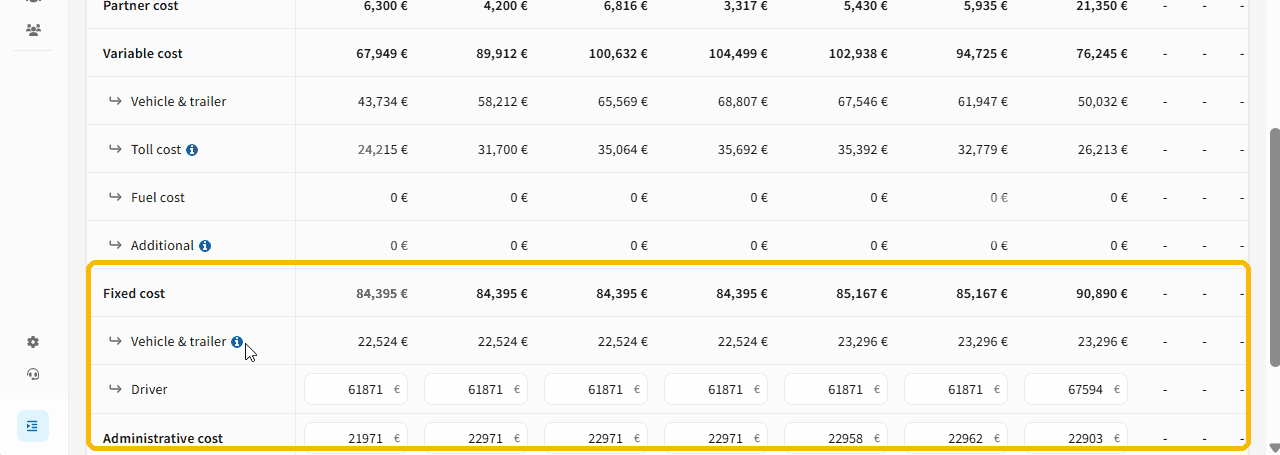
Fixed cost
Costs that occur regardless of utilization
Sum of the vehicle & trailer and driver fixed cost below
↳ Vehicle & trailer
Fixed vehicle and trailer cost
Taken from the Fleet KPIs fixed cost calculation
↳ Driver
Fixed driver cost
Calculated automatically from the drivers active that month (adding a driver only affects future months going forward). Can be manually overridden.
Administrative cost
Overhead not otherwise captured
Manual input field, for example office rent, insurance, or admin staff: anything not tied to a specific vehicle or order.
The Analytics module reports profit on two layers. Knowing which one you are looking at is the difference between a number you can trust and one that flatters you.
Order-based profit
Based only on recorded transport orders, using planned mileage and planned cost. This is accurate for subcontracted transports, because the subcontractor cost and the customer price are both known exactly.
Full company profitability
Adds fixed costs, administrative costs, and empty mileage on top of the order-based view. This is the layer that matters for companies running their own fleet, where order-based profit alone overstates your margin because it ignores the kilometers and overhead that never appear on an order.
In the Full Profitability Overview, the full-company layer is exactly the part the order-based view leaves out: the empty-mileage scaling on variable cost, plus fixed and administrative cost.
In the example above, that overhead is roughly 84,000 to 91,000 EUR of fixed cost and about 22,000 to 23,000 EUR of administrative cost per month, none of which appears in order-based profit.
Example
A tour bills the customer 900 EUR and the planned order cost is 720 EUR, so order-based profit reads 180 EUR. Once empty mileage back to the depot and the vehicle's share of fixed and administrative cost are added, full company profitability on that tour may be far lower. The gap is exactly what the second layer exists to show.
3. Notes and Limitations
Own-fleet profitability is only accurate once total fleet mileage (from telematics) and administrative costs are entered. Without them, empty mileage and overhead are excluded and profit appears too high.
Fixed and administrative cost fields can be overridden manually per month.
Key Point
To see full company profitability with confidence, keep total fleet mileage and monthly administrative costs up to date. Everything else is calculated from data already in your orders and cost profiles.