IMPARGO Knowledge Center

Unleash the full potential of our software with our comprehensive Knowledge Center, offering detailed information on its functionality and features.

  • PLANNER: Truck, Toll & Tour Calculation
  • ORDERS: Order Management
  • ORDERS: Offer Management
  • FLEET: Execute With The DriverApp
  • DRIVERAPP: Order Execution & Truck Navigation for Drivers
  • Managing Master Data
  • Integrations
  • Help Center

Track Events & Analyse Driven Routes

Table of Content

  1. See Order Execution History
  2. View & Track Order Events
  3. View & Track Driven Route
  4. Track Truck Driving Speed
  5. Executed vs. Planned Summary
  6. Monitor In-Progress Transport Orders
  7. Advanced Fleet Analytics & Reporting

The IMPARGO TMS Platform, combined with the DriverApp, provides transportation companies with essential data during order execution, including events, timestamps, GPS locations, and driving speeds. Leveraging this data enables fleet managers to gain powerful insights into their operations. Here's why analysing this data is critical:

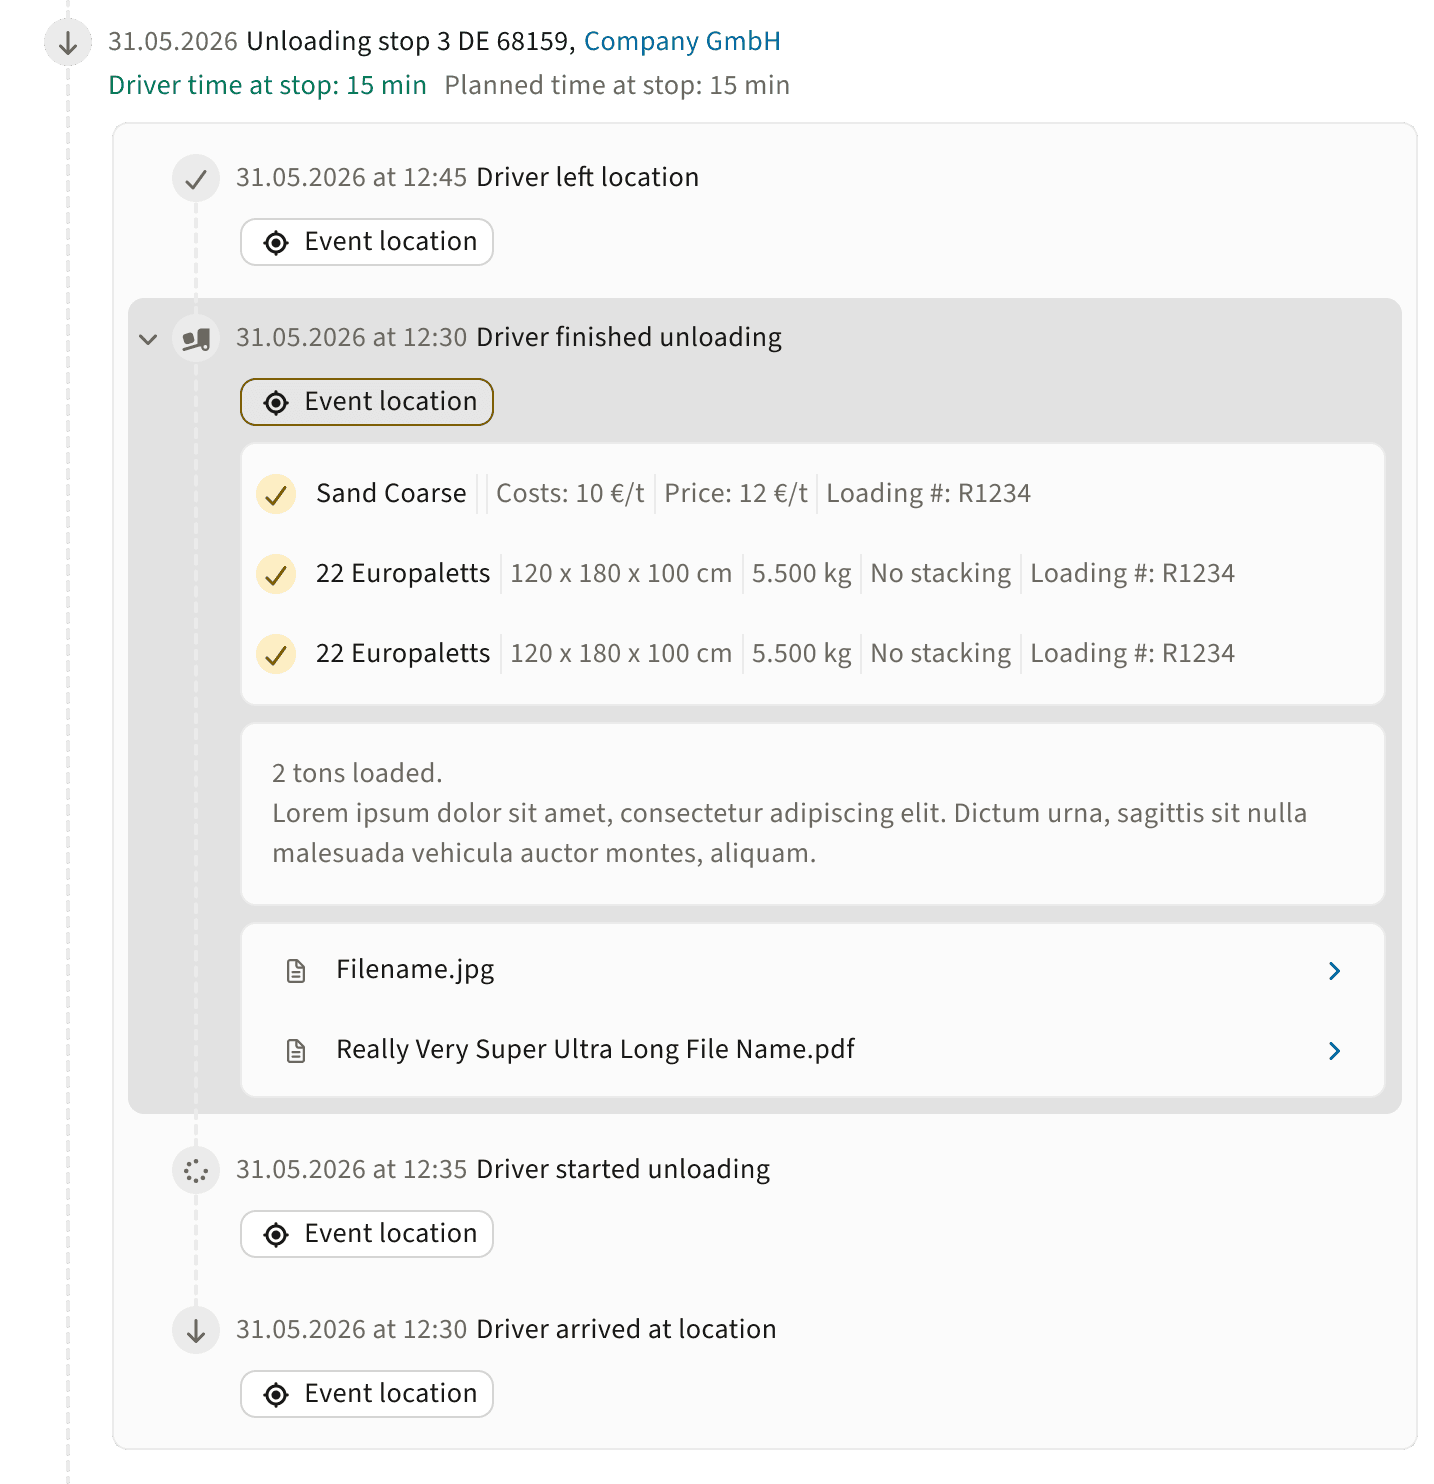
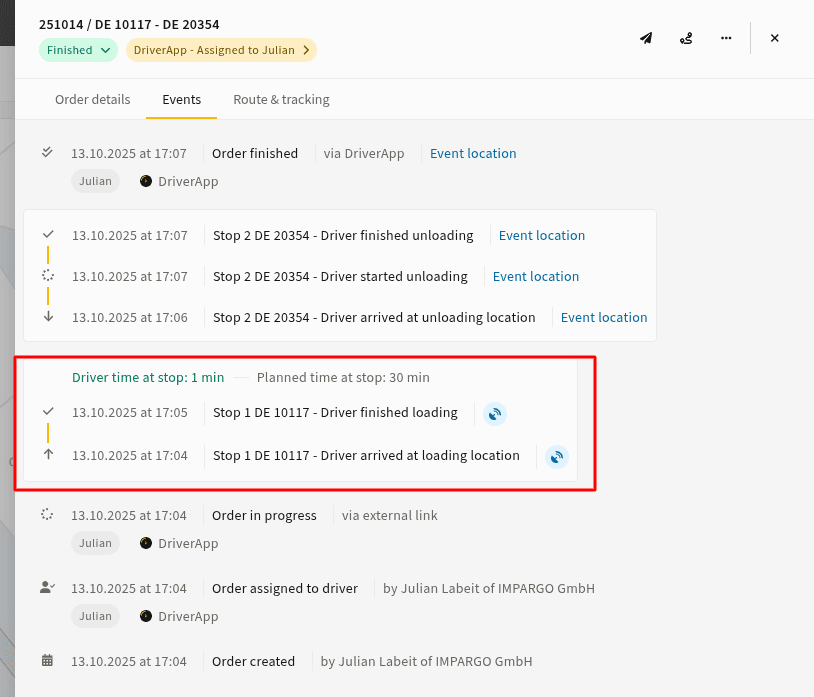
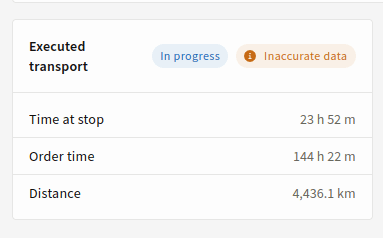
  • Improve Order Execution Transparency: Dispatchers can track every detail of the order execution process, knowing exactly what happened at each stage.
  • Resolve Customer Disputes: Historical data, such as driver arrival times, provides evidence to resolve customer disputes efficiently.
  • Prevent Fraud: By verifying driver statements with GPS and event data, you can reduce fraud risk and ensure transparency in operations.
  • Analyse Cost Discrepancies: Compare planned versus actual routes to understand why transport costs may exceed initial estimates.
  • Optimise Customer Charging: Analyse idle times at specific stops to improve the accuracy of customer billing.

This feature offers greater transparency and operational efficiency, empowering companies to make data-driven decisions and optimize fleet management.

1. See Order Execution History

To view historical data for an order, access a finished order via Fleet or Orders in the IMPARGO TMS. The order details page contains two key tabs: the Events Tab and the Route & Tracking Tab, which provide detailed historical insights.

image2.gif

2. View & Track Order Events

image1.gif

The Events Tab gives you a chronological overview of everything that happened during the order. Here's what you can track:

  • The times when drivers marked stops as completed.
  • Any uploaded photos and comments provided by drivers.
  • The driver’s exact location for key events by clicking the Event Location button.

Additionally, you can track the time drivers spent at stops. 

  • If the time spent was shorter than planned, it’s shown in green
  • If the stop exceeded the planned time, it’s highlighted in red
image5.png

This helps fleet managers identify delays or efficiencies during the transport process.


3. View & Track Driven Route

In the Route & Tracking Tab, you can view a map that displays both the planned route and the actual driven route. This provides valuable insights into deviations from the plan and helps explain any discrepancies.

EN plan vs driven gif.gif
Truck maps with planned and driven routes


The map shows:

  • Planned Route: Displayed in blue, this route represents the original plan created in the route planner and shared with the driver.
  • Driven Route: Displayed in green, this route reflects the actual path taken by the driver, recorded via GPS.
  • Key Events: Events like order start, order finish, and driver stops are marked on the map for easy reference.
image2.gif
You can toggle between viewing the planned and driven routes to compare them directly.


4. Track Truck Driving Speed

Below the map, the Driving Speed Chart shows recorded driving speeds during order execution:

  • Yellow: Indicates segments where the driver was moving.
  • Green: Represents stops or idle periods.
  • Red: Highlights segments with missing data, such as when GPS tracking was disabled.
EN speed chart gif.gif

Hovering over the chart provides detailed information, including timestamps and speed data, which is also reflected on the map. You can also switch between days if the order spans multiple days and view the driver’s average speed.


5. Executed vs. Planned Summary

Below the speed chart, you’ll find a comparison between the executed and planned transport data, including:

  1. Total Stop Time: Compares actual stop time to the planned stop time, calculated based on the “driver arrived” and “stop finished” events.
  2. Total Order Time: Compares the total order duration from start to finish.
  3. Total Distance: Shows the actual distance driven, calculated from the GPS data, compared to the planned route distance.
EN exec vs planned.gif

6. Monitor In-Progress Transport Orders

The Route & Tracking Tab also allows you to monitor orders still in progress. The data displayed is preliminary, reflecting the current state of the order. This helps dispatchers keep track of real-time stop times, order duration, and driven distances.

image3.png

In some cases, data inaccuracies may occur. For example, if a stop’s status is manually reset or GPS tracking is disabled, a warning tag will appear to notify users that the displayed values may be inaccurate.


7. Advanced Fleet Analytics & Reporting

Beyond simply viewing event and route details, IMPARGO offers advanced fleet analytics and reporting tools. Fleet managers can:

  • Compare Costs: Analyze the differences between planned and actual transport costs.
  • Optimize Routes: Identify potential improvements by analyzing deviations between the planned and driven routes.
  • Generate Reports: Create reports based on vehicles, routes, or customer-specific data for better operational insights.

These features allow transportation companies to make informed, data-driven decisions and continually optimize their fleet management strategies.

Contact us today to set up custom analytics for your fleet: Contact IMPARGO.

Track Driver Status

Chat With Truck Driver


Impargo-logo

Digitalize your transport business overnight.

© IMPARGO 2025, All rights reserved.